[1]:
# ruff: noqa
Quick Start
See the API for more detailed information, examples, formulas, and references for each function.
[2]:
import matplotlib.pyplot as plt
import numpy as np
import xarray as xr

import xskillscore as xs

np.random.seed(seed=42)
Here, we generate some sample gridded data. Our data has three time steps, and a 4x5 latitude/longitude grid. obs denotes some verification data (sometimes termed y) and fct some forecast data (e.g. from a statistical or dynamical model; sometimes termed yhat).
[3]:
obs = xr.DataArray(
    np.random.rand(3, 4, 5),
    coords=[
        xr.cftime_range("2000-01-01", "2000-01-03", freq="D"),
        np.arange(4),
        np.arange(5),
    ],
    dims=["time", "lat", "lon"],
    name="var",
)
fct = obs.copy()
fct.values = np.random.rand(3, 4, 5)
Deterministic Metrics
xskillscore offers a suite of correlation-based and distance-based deterministic metrics:
Correlation-Based
Effective Sample Size (
effective_sample_size)Pearson Correlation (
pearson_r)Pearson Correlation effective p value (
pearson_r_eff_p_value)Pearson Correlation p value (
pearson_r_p_value)Slope of Linear Fit (
linslope)Spearman Correlation (
spearman_r)Spearman Correlation effective p value (
spearman_r_eff_p_value)Spearman Correlation p value (
spearman_r_p_value)
Distance-Based
Coefficient of Determination (
r2)Mean Absolute Error (
mae)Mean Absolute Percentage Error (
mape)Mean Error (
me)Mean Squared Error (
mse)Median Absolute Error (
median_absolute_error)Root Mean Squared Error (
rmse)Symmetric Mean Absolute Percentage Error (
smape)
Calling the functions is very straight-forward. All deterministic functions take the form func(a, b, dim=None, **kwargs). Notice that the original dataset is reduced by the dimension passed. I.e., since we passed time as the dimension here, we are returned an object with dimensions (lat, lon). For correlation metrics dim cannot be [].
[4]:
r = xs.pearson_r(obs, fct, dim="time")
print(r)
<xarray.DataArray 'var' (lat: 4, lon: 5)> Size: 160B
array([[ 0.99509676, -0.88499394,  0.94083077,  0.96521259, -0.13696899],
       [-0.90613709,  0.51585291,  0.72875703,  0.19331043,  0.79754067],
       [-0.80112059, -0.95632624, -0.23640403, -0.57684283,  0.43389289],
       [ 0.00230351, -0.58970109, -0.87332763, -0.99992557, -0.31404248]])
Coordinates:
  * lat      (lat) int64 32B 0 1 2 3
  * lon      (lon) int64 40B 0 1 2 3 4
[5]:
p = xs.pearson_r_p_value(obs, fct, dim="time")
print(p)
<xarray.DataArray 'var' (lat: 4, lon: 5)> Size: 160B
array([[0.06306879, 0.30832471, 0.22009394, 0.1684121 , 0.91252786],
       [0.2780348 , 0.6549502 , 0.48019675, 0.87615511, 0.41226788],
       [0.40847506, 0.1888421 , 0.84806222, 0.60856901, 0.71427925],
       [0.99853354, 0.59849112, 0.32391484, 0.00776728, 0.79663312]])
Coordinates:
  * lat      (lat) int64 32B 0 1 2 3
  * lon      (lon) int64 40B 0 1 2 3 4
You can also specify multiple axes for deterministic metrics. Here, we apply it over the latitude and longitude dimension (a pattern correlation).
[6]:
r = xs.pearson_r(obs, fct, dim=["lat", "lon"])
print(r)
<xarray.DataArray 'var' (time: 3)> Size: 24B
array([-0.16920304, -0.06326809,  0.18040449])
Coordinates:
  * time     (time) object 24B 2000-01-01 00:00:00 ... 2000-01-03 00:00:00
All deterministic metrics except for effective_sample_size, pearson_r_eff_p_value and spearman_r_eff_p_value can take the kwarg weights=.... weights should be a DataArray of the size of the reduced dimension (e.g., if time is being reduced it should be of length 3 in our example).
Weighting is a common practice when working with observations and model simulations of the Earth system. When working with rectilinear grids, one can weight the data by the cosine of the latitude, which is maximum at the equator and minimum at the poles (as in the below example). More complicated model grids tend to be accompanied by a cell area varaible, which could also be passed into this function.
[7]:
obs2 = xr.DataArray(
    np.random.rand(3, 180, 360),
    coords=[
        xr.cftime_range("2000-01-01", "2000-01-03", freq="D"),
        np.linspace(-89.5, 89.5, 180),
        np.linspace(-179.5, 179.5, 360),
    ],
    dims=["time", "lat", "lon"],
)
fct2 = obs2.copy()
fct2.values = np.random.rand(3, 180, 360)
[8]:
# make weights as cosine of the latitude and broadcast
weights = np.cos(np.deg2rad(obs2.lat))
_, weights = xr.broadcast(obs2, weights)

# Remove the time dimension from weights
weights = weights.isel(time=0)
[9]:
r_weighted = xs.pearson_r(obs2, fct2, dim=["lat", "lon"], weights=weights)
print(r_weighted)
<xarray.DataArray (time: 3)> Size: 24B
array([-0.0020303 , -0.00498588, -0.00401522])
Coordinates:
  * time     (time) object 24B 2000-01-01 00:00:00 ... 2000-01-03 00:00:00
[10]:
r_unweighted = xs.pearson_r(obs2, fct2, dim=["lat", "lon"], weights=None)
print(r_unweighted)
<xarray.DataArray (time: 3)> Size: 24B
array([ 5.72646719e-05, -4.32380560e-03,  4.17909845e-05])
Coordinates:
  * time     (time) object 24B 2000-01-01 00:00:00 ... 2000-01-03 00:00:00
You can also pass the optional boolean kwarg skipna. If True, ignore any NaNs (pairwise) in obs and fct when computing the result. If False, return NaNs anywhere there are pairwise NaNs.
[11]:
obs_with_nans = obs.where(obs.lat > 1)
fct_with_nans = fct.where(fct.lat > 1)
print(obs_with_nans)
<xarray.DataArray 'var' (time: 3, lat: 4, lon: 5)> Size: 480B
array([[[       nan,        nan,        nan,        nan,        nan],
        [       nan,        nan,        nan,        nan,        nan],
        [0.02058449, 0.96990985, 0.83244264, 0.21233911, 0.18182497],
        [0.18340451, 0.30424224, 0.52475643, 0.43194502, 0.29122914]],

       [[       nan,        nan,        nan,        nan,        nan],
        [       nan,        nan,        nan,        nan,        nan],
        [0.60754485, 0.17052412, 0.06505159, 0.94888554, 0.96563203],
        [0.80839735, 0.30461377, 0.09767211, 0.68423303, 0.44015249]],

       [[       nan,        nan,        nan,        nan,        nan],
        [       nan,        nan,        nan,        nan,        nan],
        [0.96958463, 0.77513282, 0.93949894, 0.89482735, 0.59789998],
        [0.92187424, 0.0884925 , 0.19598286, 0.04522729, 0.32533033]]])
Coordinates:
  * time     (time) object 24B 2000-01-01 00:00:00 ... 2000-01-03 00:00:00
  * lat      (lat) int64 32B 0 1 2 3
  * lon      (lon) int64 40B 0 1 2 3 4
[12]:
mae_with_skipna = xs.mae(obs_with_nans, fct_with_nans, dim=["lat", "lon"], skipna=True)
print(mae_with_skipna)
<xarray.DataArray 'var' (time: 3)> Size: 24B
array([0.51901116, 0.41623426, 0.32621064])
Coordinates:
  * time     (time) object 24B 2000-01-01 00:00:00 ... 2000-01-03 00:00:00
[13]:
mae_without_skipna = xs.mae(
    obs_with_nans, fct_with_nans, dim=["lat", "lon"], skipna=False
)
print(mae_without_skipna)
<xarray.DataArray 'var' (time: 3)> Size: 24B
array([nan, nan, nan])
Coordinates:
  * time     (time) object 24B 2000-01-01 00:00:00 ... 2000-01-03 00:00:00
Probabilistic Metrics
xskillscore offers a suite of probabilistic metrics:
Brier Score (
brier_score)Brier scores of an ensemble for exceeding given thresholds (
threshold_brier_score)Continuous Ranked Probability Score with a gaussian distribution (
crps_gaussian)Continuous Ranked Probability Score with numerical integration of the normal distribution (
crps_quadrature)Continuous Ranked Probability Score with the ensemble distribution (
crps_ensemble)Discrimination (
discrimination)Rank Histogram (
rank_histogram)Ranked Probability Score (
rps)Receiver Operating Characteristic (
roc)Reliability (
reliability)
We now create some data with an ensemble member dimension. In this case, we envision an ensemble forecast with multiple members to validate against our theoretical observations:
[14]:
obs3 = xr.DataArray(
    np.random.rand(4, 5),
    coords=[np.arange(4), np.arange(5)],
    dims=["lat", "lon"],
    name="var",
)
fct3 = xr.DataArray(
    np.random.rand(3, 4, 5),
    coords=[np.arange(3), np.arange(4), np.arange(5)],
    dims=["member", "lat", "lon"],
    name="var",
)
Continuous Ranked Probability Score with the ensemble distribution. Pass dim=[] to get the same behaviour as properscoring.crps_ensemble without any averaging over dim.
[15]:
crps_ensemble = xs.crps_ensemble(obs3, fct3, dim=[])
print(crps_ensemble)
<xarray.DataArray 'var' (lat: 4, lon: 5)> Size: 160B
array([[0.19918258, 0.10670612, 0.11858151, 0.15974459, 0.26841063],
       [0.08038415, 0.13237479, 0.23778382, 0.18009214, 0.08326884],
       [0.08589149, 0.11666573, 0.21579228, 0.09646599, 0.12855359],
       [0.19891371, 0.10470738, 0.05289158, 0.107965  , 0.11143681]])
Coordinates:
  * lat      (lat) int64 32B 0 1 2 3
  * lon      (lon) int64 40B 0 1 2 3 4
The CRPS with a Gaussian distribution requires two parameters: \(\mu\) and \(\sigma\) from the forecast distribution. Here, we just use the ensemble mean and ensemble spread.
[16]:
crps_gaussian = xs.crps_gaussian(obs3, fct3.mean("member"), fct3.std("member"), dim=[])
print(crps_gaussian)
<xarray.DataArray 'var' (lat: 4, lon: 5)> Size: 160B
array([[0.19821619, 0.11640329, 0.14219455, 0.15912935, 0.28104703],
       [0.08953392, 0.11758925, 0.25156378, 0.095484  , 0.10679842],
       [0.05069082, 0.07081479, 0.24529056, 0.08700853, 0.09535839],
       [0.1931706 , 0.11233935, 0.0783092 , 0.09593862, 0.11037143]])
Coordinates:
  * lat      (lat) int64 32B 0 1 2 3
  * lon      (lon) int64 40B 0 1 2 3 4
The CRPS quadrature metric requires a callable distribution function. Here we use norm from scipy.stats.
[17]:
from scipy.stats import norm

crps_quadrature = xs.crps_quadrature(obs3, norm, dim=[])
print(crps_quadrature)
<xarray.DataArray (lat: 4, lon: 5)> Size: 160B
array([[0.52852898, 0.58042038, 0.46945497, 0.25013942, 0.23370234],
       [0.39109762, 0.24071855, 0.25557803, 0.28994381, 0.23764056],
       [0.40236669, 0.33477031, 0.24063375, 0.45538915, 0.48236113],
       [0.42011508, 0.4174865 , 0.24837346, 0.43954946, 0.44689198]])
Coordinates:
  * lat      (lat) int64 32B 0 1 2 3
  * lon      (lon) int64 40B 0 1 2 3 4
We can also use a threshold Brier Score, to score hits over a certain threshold. Ranked Probability Score for two categories yields the same result.
[18]:
threshold_brier_score = xs.threshold_brier_score(obs3, fct3, 0.5, dim=None)
print(threshold_brier_score)
<xarray.DataArray 'var' ()> Size: 8B
array(0.15555556)
Coordinates:
    threshold  float64 8B 0.5
[19]:
brier_score = xs.brier_score(obs3 > 0.5, (fct3 > 0.5).mean("member"))
print(brier_score)
<xarray.DataArray 'var' ()> Size: 8B
array(0.15555556)
[20]:
rps = xs.rps(obs3 > 0.5, fct3 > 0.5, category_edges=np.array([0.5]))
print(rps)
<xarray.DataArray ()> Size: 8B
array(0.15555556)
[21]:
rank_histogram = xs.rank_histogram(obs3, fct3)
print(rank_histogram)
<xarray.DataArray 'histogram_rank' (rank: 4)> Size: 32B
array([3, 8, 6, 3])
Coordinates:
  * rank     (rank) float64 32B 1.0 2.0 3.0 4.0
[22]:
disc = xs.discrimination(obs3 > 0.5, (fct3 > 0.5).mean("member"))
print(disc)
<xarray.DataArray (event: 2, forecast_probability: 5)> Size: 80B
array([[0.        , 0.08333333, 0.        , 0.66666667, 0.25      ],
       [0.125     , 0.5       , 0.        , 0.375     , 0.        ]])
Coordinates:
  * forecast_probability  (forecast_probability) float64 40B 0.1 0.3 0.5 0.7 0.9
  * event                 (event) bool 2B True False
[23]:
rel = xs.reliability(obs3 > 0.5, (fct3 > 0.5).mean("member"))
print(rel)
<xarray.DataArray 'var' (forecast_probability: 5)> Size: 40B
array([0.        , 0.2       ,        nan, 0.72727273, 1.        ])
Coordinates:
  * forecast_probability  (forecast_probability) float64 40B 0.1 0.3 0.5 0.7 0.9
    samples               (forecast_probability) float64 40B 1.0 5.0 ... 3.0
/home/docs/checkouts/readthedocs.org/user_builds/xskillscore/checkouts/latest/xskillscore/core/np_probabilistic.py:40: RuntimeWarning: invalid value encountered in scalar divide
  r[..., i] = N_o_f_in_bin / N_f_in_bin
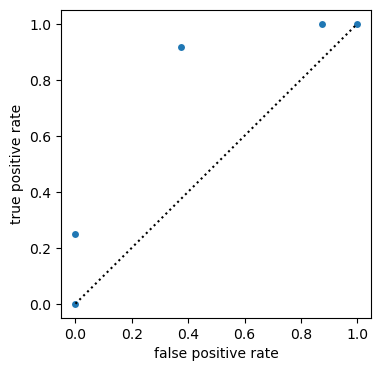
[24]:
# ROC for probabilistic forecasts and bin_edges='continuous' default
roc = xs.roc(
    obs3 > 0.5, (fct3 > 0.5).mean("member"), return_results="all_as_metric_dim"
)

plt.figure(figsize=(4, 4))
plt.plot([0, 1], [0, 1], "k:")
roc.to_dataset(dim="metric").plot.scatter(
    y="true positive rate", x="false positive rate"
)
roc.sel(metric="area under curve").values[0]
/home/docs/checkouts/readthedocs.org/user_builds/xskillscore/conda/latest/lib/python3.12/site-packages/xhistogram/core.py:384: RuntimeWarning: Converting input from bool to <class 'numpy.uint8'> for compatibility.
  np.histogram_bin_edges(
/home/docs/checkouts/readthedocs.org/user_builds/xskillscore/conda/latest/lib/python3.12/site-packages/xhistogram/core.py:384: RuntimeWarning: Converting input from bool to <class 'numpy.uint8'> for compatibility.
  np.histogram_bin_edges(
/home/docs/checkouts/readthedocs.org/user_builds/xskillscore/conda/latest/lib/python3.12/site-packages/xhistogram/core.py:384: RuntimeWarning: Converting input from bool to <class 'numpy.uint8'> for compatibility.
  np.histogram_bin_edges(
/home/docs/checkouts/readthedocs.org/user_builds/xskillscore/conda/latest/lib/python3.12/site-packages/xhistogram/core.py:384: RuntimeWarning: Converting input from bool to <class 'numpy.uint8'> for compatibility.
  np.histogram_bin_edges(
/home/docs/checkouts/readthedocs.org/user_builds/xskillscore/conda/latest/lib/python3.12/site-packages/xhistogram/core.py:384: RuntimeWarning: Converting input from bool to <class 'numpy.uint8'> for compatibility.
  np.histogram_bin_edges(
[24]:
0.8229166666666666
Contingency-Based
To work with contingency-based scoring, first instantiate a Contingency object by passing in your observations, forecast, and observation/forecast bin edges. See https://www.cawcr.gov.au/projects/verification/#Contingency_table for more information.
[25]:
dichotomous_category_edges = np.array([0, 0.5, 1])  # "dichotomous" mean two-category
dichotomous_contingency = xs.Contingency(
    obs, fct, dichotomous_category_edges, dichotomous_category_edges, dim=["lat", "lon"]
)
dichotomous_contingency_table = dichotomous_contingency.table
print(dichotomous_contingency_table)
<xarray.DataArray 'histogram_observations_forecasts' (time: 3,
                                                      observations_category: 2,
                                                      forecasts_category: 2)> Size: 96B
array([[[5, 6],
        [6, 3]],

       [[6, 5],
        [4, 5]],

       [[5, 5],
        [4, 6]]])
Coordinates:
  * time                          (time) object 24B 2000-01-01 00:00:00 ... 2...
    observations_category_bounds  (observations_category) <U10 80B '[0.0, 0.5...
    forecasts_category_bounds     (forecasts_category) <U10 80B '[0.0, 0.5)' ...
  * observations_category         (observations_category) int64 16B 1 2
  * forecasts_category            (forecasts_category) int64 16B 1 2
[26]:
print(
    dichotomous_contingency_table.to_dataframe()
    .pivot_table(
        index=["forecasts_category", "forecasts_category_bounds"],
        columns=["observations_category", "observations_category_bounds"],
    )
    .round(2)
)
                                             histogram_observations_forecasts  \
observations_category                                                       1
observations_category_bounds                                       [0.0, 0.5)
forecasts_category forecasts_category_bounds
1                  [0.0, 0.5)                                            5.33
2                  [0.5, 1.0]                                            5.33


observations_category                                 2
observations_category_bounds                 [0.5, 1.0]
forecasts_category forecasts_category_bounds
1                  [0.0, 0.5)                      4.67
2                  [0.5, 1.0]                      4.67
Scores based on the constructed contingency table can be called via class methods. The available methods are:
Accuracy (
accuracy)Bias Score (
bias_score)Equitable Threat Score (
equit_threat_score)False Alarms / False Positives (
false_alarms)False Alarm Ratio / False Discovery Rate (
false_alarm_ratio)False Alarm Rate / False Positive Rate / Fall-out (
false_alarm_rate)Gerrity Score (
gerrity_score)Heidke Score / Cohen’s Kappa (
heidke_score)Hit Rate / Recall / Sensitivity / True Positive Rate (
hit_rate)Hits / True Positives (
hits)Misses / False Negatives (
misses)Odds Ratio (
odds_ratio)Odds Ratio Skill Score (
odds_ratio_skill_score)Peirce Score (
peirce_score)Receiver Operating Characteristic (
roc)Success Ratio / Precision / Positive Predictive Value (
success_ratio)Threat Score / Critical Success Index (
threat_score)
Below, we share a few examples of these in action:
[27]:
print(dichotomous_contingency.bias_score())
<xarray.DataArray 'histogram_observations_forecasts' (time: 3)> Size: 24B
array([1.        , 1.11111111, 1.1       ])
Coordinates:
  * time     (time) object 24B 2000-01-01 00:00:00 ... 2000-01-03 00:00:00
[28]:
print(dichotomous_contingency.hit_rate())
<xarray.DataArray 'histogram_observations_forecasts' (time: 3)> Size: 24B
array([0.33333333, 0.55555556, 0.6       ])
Coordinates:
  * time     (time) object 24B 2000-01-01 00:00:00 ... 2000-01-03 00:00:00
[29]:
print(dichotomous_contingency.false_alarm_rate())
<xarray.DataArray 'histogram_observations_forecasts' (time: 3)> Size: 24B
array([0.54545455, 0.45454545, 0.5       ])
Coordinates:
  * time     (time) object 24B 2000-01-01 00:00:00 ... 2000-01-03 00:00:00
[30]:
print(dichotomous_contingency.odds_ratio_skill_score())
<xarray.DataArray 'histogram_observations_forecasts' (time: 3)> Size: 24B
array([-0.41176471,  0.2       ,  0.2       ])
Coordinates:
  * time     (time) object 24B 2000-01-01 00:00:00 ... 2000-01-03 00:00:00
Now we can leverage multi-category edges to make use of some scores.
[31]:
multi_category_edges = np.array([0, 0.25, 0.75, 1])
multicategory_contingency = xs.Contingency(
    obs, fct, multi_category_edges, multi_category_edges, dim=["lat", "lon"]
)
[32]:
print(multicategory_contingency.accuracy())
<xarray.DataArray 'histogram_observations_forecasts' (time: 3)> Size: 24B
array([0.25, 0.25, 0.5 ])
Coordinates:
  * time     (time) object 24B 2000-01-01 00:00:00 ... 2000-01-03 00:00:00
[33]:
print(multicategory_contingency.heidke_score())
<xarray.DataArray 'histogram_observations_forecasts' (time: 3)> Size: 24B
array([-0.14503817, -0.25      ,  0.2481203 ])
Coordinates:
  * time     (time) object 24B 2000-01-01 00:00:00 ... 2000-01-03 00:00:00
[34]:
print(multicategory_contingency.peirce_score())
<xarray.DataArray 'histogram_observations_forecasts' (time: 3)> Size: 24B
array([-0.1496063 , -0.24193548,  0.25      ])
Coordinates:
  * time     (time) object 24B 2000-01-01 00:00:00 ... 2000-01-03 00:00:00
[35]:
print(multicategory_contingency.gerrity_score())
<xarray.DataArray 'histogram_observations_forecasts' (time: 3)> Size: 24B
array([-0.15212912, -0.11160714,  0.25      ])
Coordinates:
  * time     (time) object 24B 2000-01-01 00:00:00 ... 2000-01-03 00:00:00
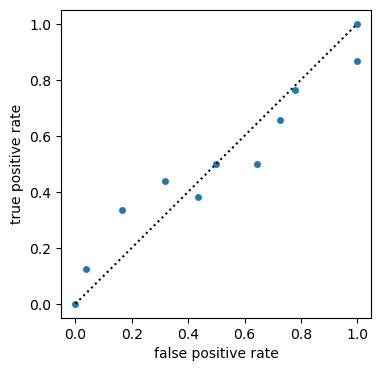
[36]:
# ROC for deterministic forecasts and bin_edges
roc = xs.roc(obs, fct, np.linspace(0, 1, 11), return_results="all_as_metric_dim")

plt.figure(figsize=(4, 4))
plt.plot([0, 1], [0, 1], "k:")
roc.to_dataset(dim="metric").plot.scatter(
    y="true positive rate", x="false positive rate"
)
roc.sel(metric="area under curve").values[0]
[36]:
0.5035528250988777
Comparative
Tests to compare whether one forecast is significantly better than another one.
Sign test
[37]:
length = 100
obs_1d = xr.DataArray(
    np.random.rand(length),
    coords=[
        np.arange(length),
    ],
    dims=["time"],
    name="var",
)
fct_1d = obs_1d.copy()
fct_1d.values = np.random.rand(length)
[38]:
# given you want to test whether one forecast is better than another forecast
significantly_different, walk, confidence = xs.sign_test(
    fct_1d, fct_1d + 0.2, obs_1d, time_dim="time", metric="mae", orientation="negative"
)
[39]:
walk.plot()
confidence.plot(c="gray")
(-1 * confidence).plot(c="gray")
[39]:
[<matplotlib.lines.Line2D at 0x7fb3eb3c2ae0>]
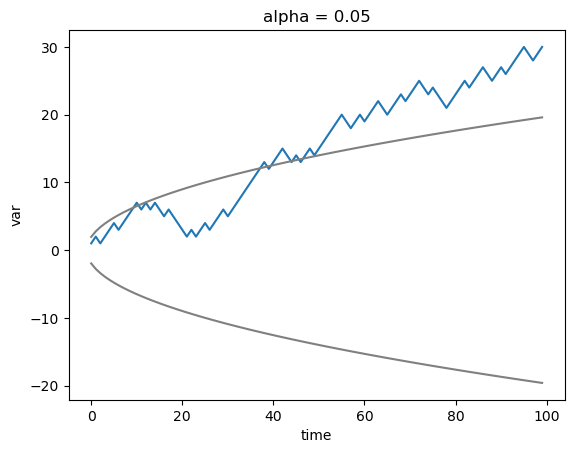
Half-width Confidence Interval test
[40]:
# create a worse forecast with high but different to perfect correlation and choose RMSE as the distance metric
fct_1d_worse = fct_1d.copy()
step = 3
fct_1d_worse[::step] = fct_1d[::step].values + 0.1
metric = "rmse"
[41]:
# half-with of the confidence interval at level alpha is larger than the RMSE differences,
# therefore not significant
alpha = 0.05
significantly_different, diff, hwci = xs.halfwidth_ci_test(
    fct_1d, fct_1d_worse, obs_1d, metric, time_dim="time", dim=[], alpha=alpha
)
print(diff)
print(hwci)
print(
    f"RMSEs significantly different at level {alpha} : {bool(significantly_different)}"
)
<xarray.DataArray 'var' ()> Size: 8B
array(0.00734139)
<xarray.DataArray 'var' ()> Size: 8B
array(0.01108879)
RMSEs significantly different at level 0.05 : False
Statistical tests
Multiple tests
A statistical test is applied multiple times on a spatial grid. multipletests helps controlling the false discovery rate (FDR) of p values.
[42]:
p = xs.pearson_r_p_value(fct, obs, "time")
print(p)
<xarray.DataArray 'var' (lat: 4, lon: 5)> Size: 160B
array([[0.06306879, 0.30832471, 0.22009394, 0.1684121 , 0.91252786],
       [0.2780348 , 0.6549502 , 0.48019675, 0.87615511, 0.41226788],
       [0.40847506, 0.1888421 , 0.84806222, 0.60856901, 0.71427925],
       [0.99853354, 0.59849112, 0.32391484, 0.00776728, 0.79663312]])
Coordinates:
  * lat      (lat) int64 32B 0 1 2 3
  * lon      (lon) int64 40B 0 1 2 3 4
[43]:
p_corrected = xs.multipletests(
    p, alpha=0.5, method="fdr_bh", return_results="pvals_corrected"
)
print(p_corrected)
<xarray.DataArray 'var' (lat: 4, lon: 5)> Size: 160B
array([[0.06306879, 0.30832471, 0.22009394, 0.1684121 , 0.91252786],
       [0.2780348 , 0.6549502 , 0.48019675, 0.87615511, 0.41226788],
       [0.40847506, 0.1888421 , 0.84806222, 0.60856901, 0.71427925],
       [0.99853354, 0.59849112, 0.32391484, 0.00776728, 0.79663312]])
Coordinates:
  * lat                   (lat) int64 32B 0 1 2 3
  * lon                   (lon) int64 40B 0 1 2 3 4
    multipletests_method  <U6 24B 'fdr_bh'
    multipletests_alpha   float64 8B 0.5
    result                <U15 60B 'pvals_corrected'
[44]:
assert not p_corrected.equals(p)
Accessors
You can also use xskillscore as a method of your xarray Dataset.
[45]:
ds = xr.Dataset()
ds["obs_var"] = obs
ds["fct_var"] = fct
In the case that your Dataset contains both your observation and forecast variable, just pass them as strings into the function.
[46]:
print(ds.xs.pearson_r("obs_var", "fct_var", dim="time"))
<xarray.DataArray (lat: 4, lon: 5)> Size: 160B
array([[ 0.99509676, -0.88499394,  0.94083077,  0.96521259, -0.13696899],
       [-0.90613709,  0.51585291,  0.72875703,  0.19331043,  0.79754067],
       [-0.80112059, -0.95632624, -0.23640403, -0.57684283,  0.43389289],
       [ 0.00230351, -0.58970109, -0.87332763, -0.99992557, -0.31404248]])
Coordinates:
  * lat      (lat) int64 32B 0 1 2 3
  * lon      (lon) int64 40B 0 1 2 3 4
You can also pass in a separate Dataset that contains your observations or forecast variable.
[47]:
ds = ds.drop_vars("fct_var")
print(ds.xs.pearson_r("obs_var", fct, dim="time"))
<xarray.DataArray (lat: 4, lon: 5)> Size: 160B
array([[ 0.99509676, -0.88499394,  0.94083077,  0.96521259, -0.13696899],
       [-0.90613709,  0.51585291,  0.72875703,  0.19331043,  0.79754067],
       [-0.80112059, -0.95632624, -0.23640403, -0.57684283,  0.43389289],
       [ 0.00230351, -0.58970109, -0.87332763, -0.99992557, -0.31404248]])
Coordinates:
  * lat      (lat) int64 32B 0 1 2 3
  * lon      (lon) int64 40B 0 1 2 3 4
Resampling
randomly resample the
timedimension and then take mean overtimeto get resample thresholdresample over
memberdimension to get uncertainty due to member sampling in hindcasts
[48]:
# create large one-dimensional array
s = 1000
f = xr.DataArray(
    np.random.normal(size=s), dims="member", coords={"member": np.arange(s)}, name="var"
)
[49]:
# resample with replacement in that one dimension
iterations = 100
%timeit f_r = xs.resampling.resample_iterations(f, iterations, 'member', replace=True)
# resample_iterations_idx is much (50x) faster because it involves no loops
%timeit f_r = xs.resampling.resample_iterations_idx(f, iterations, 'member', replace=True)
# but both do the same resampling
82.5 ms ± 823 µs per loop (mean ± std. dev. of 7 runs, 10 loops each)
1.46 ms ± 1.89 µs per loop (mean ± std. dev. of 7 runs, 1,000 loops each)
use
resample_iterationsfor very large data, because very robust, chunksize stays contants and only more tasks are addeduse
resample_iterations_idxfor small data always and very large data only, when chunked to small chunks in the other dimensions, because the function increases the input chunksize by factoriterations
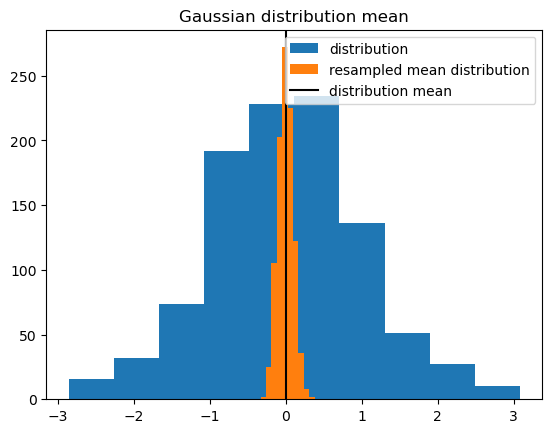
[50]:
f_r = xs.resampling.resample_iterations_idx(f, iterations, "member", replace=True)
f.plot.hist(label="distribution")
f_r.mean("iteration").plot.hist(label="resampled mean distribution")
plt.axvline(x=f.mean("member"), c="k", label="distribution mean")
plt.title("Gaussian distribution mean")
plt.legend()
[50]:
<matplotlib.legend.Legend at 0x7fb3f35474d0>
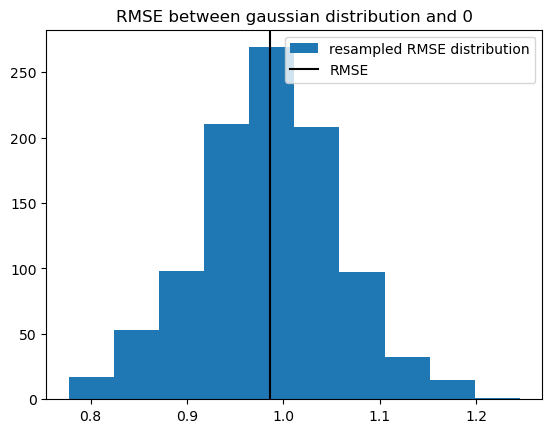
[51]:
# we can calculate the distribution of the RMSE of 0 and f resampled over member
xs.rmse(f_r, xr.zeros_like(f_r), dim="iteration").plot.hist(
    label="resampled RMSE distribution"
)
# the gaussian distribution should have an RMSE with 0 of one
plt.axvline(x=xs.rmse(f, xr.zeros_like(f)), c="k", label="RMSE")
plt.title("RMSE between gaussian distribution and 0")
plt.legend()
[51]:
<matplotlib.legend.Legend at 0x7fb3f3516f00>